 |


Tailoring Your Technical Approach
to Currency "Personalities"
by: Brian Dolan
Every currency pair has qualities unique to it.
Find out what those qualities are.
Much
has been written about the suitability of technical analysis for
trading in the currency markets. While this is undoubtedly true, it can
leave traders, particularly those new to the currency markets, with the
impression that all technical tools are equally applicable to all major
currency pairs. Perhaps most dangerous from the standpoint of
profitability, it can also seduce traders into searching for the
proverbial silver bullet: that magic technical tool or study that works
for all currency pairs, all the time. However, anyone who has traded
forex for any length of time will recognize that, for example,
dollar/Yen (USD/JPY) and dollar/Swiss (USD/CHF) trade in distinctly
different fashions.
Why, then, should a
one-size-fits-all technical approach be expected to produce steady
trading results? Instead, traders are more likely to experience
improved results if they recognize the differences between the major
currency pairs and employ different technical strategies to them. This
article will explore some of the differences between the major currency
pairs and suggest technical approaches that are best suited to each
pair's behavioral tendencies.
The Biggie
By far the most actively traded currency pair is euro/dollar (EUR/USD),
accounting for 28 percent of daily global volume in the most recent
Bank for International Settlements (BIS) survey of currency market
activity. EUR/USD receives further interest from volume generated by
the Euro-crosses (e.g. euro/British pound (EUR/GBP), EUR/CHF and
EUR/JPY, and this interest tends to be contrary to the underlying U.S.
dollar direction. For example, in a U.S. dollar-negative environment,
the Euro will have an underlying bid stemming from overall U.S. dollar
selling. However, less liquid dollar pairs (e.g. USD/CHF) will be sold
through the more liquid Euro crosses, in this case resulting in EUR/CHF
selling, which introduces a Euro offer into the EUR/USD market.
This two-way interest tends to
slow Euro movements relative to other major dollar pairs and makes it
an ideal market for short-term traders, who can exploit "backing and
filling." On the other hand, this depth of liquidity also means EUR/USD
tends to experience prolonged, seemingly inconclusive tests of
technical levels, whether generated by trendline analysis or
Fibonacci/Elliott wave calculations. This suggests breakout traders
need to allow for a greater margin of error: 20-30 pips. (A pip is the
smallest increment in which a foreign currency can trade with respect
to identifying breaks of technical levels.) Another way to gauge
whether EUR/USD is breaking out is to look to the less liquid USD/CHF
and GBP/USD. If these pairs have broken equivalent technical levels,
for example recent daily highs, then EUR/USD is likely to do the same
after a lag. If "Swissy" and "Cable" (popular name for British pound)
are stalling at those levels, then EUR/USD will likely fail as well.
Customize Your Settings
In terms of technical studies, the overwhelming depth of EUR/USD
suggests that momentum oscillators are well-suited to trading the euro,
but traders should consider adjusting the studies' parameters (increase
time periods) to account for the relatively plodding, back-and-fill
movements of EUR/USD. See Figure 1. In this sense, reliance on very
short-term indicators (less than 30 minutes) exposes traders to an
increased likelihood of "whipsaw" movements. Moving average convergence
divergence (MACD) as a momentum study is well-suited to EUR/USD,
particularly because it utilizes exponential moving averages (greater
weight to more recent prices, less to old prices) in conjunction with a
third moving average, resulting in fewer 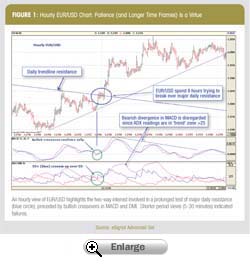 false
crossovers. Short-term (hourly) momentum divergences routinely occur in
EUR/USD, but they need to be confirmed by breaks of price levels
identified though trendline analysis to suggest an actionable trade.
When larger moves are underway, traders are also likely to find the
directional movement indicator (DMI) system useful for confirming
whether a trend is in place, in which case momentum readings should be
discounted, and might choose to rely on DI+/DI- crossovers for
additional trade entry signals. false
crossovers. Short-term (hourly) momentum divergences routinely occur in
EUR/USD, but they need to be confirmed by breaks of price levels
identified though trendline analysis to suggest an actionable trade.
When larger moves are underway, traders are also likely to find the
directional movement indicator (DMI) system useful for confirming
whether a trend is in place, in which case momentum readings should be
discounted, and might choose to rely on DI+/DI- crossovers for
additional trade entry signals.
Second Place
The next most actively traded currency pair is USD/JPY, which accounted
for 17 percent of daily global volume in the 2004 BIS survey of
currency market turnover. USD/JPY has traditionally been the most
politically sensitive currency pair, with successive U.S. governments
using the exchange rate as a lever in trade negotiations with Japan.
While China has recently replaced Japan as the Asian market evoking
U.S. trade tensions, USD/JPY still acts as a regional currency proxy
for China and other less-liquid, highly regulated Asian currencies. In
this sense, USD/JPY is frequently prone to extended trending periods as
trade or regional political themes (e.g. yuan revaluation) play out.
For day-to-day trading, however,
the most significant feature of USD/JPY is the heavy influence exerted
by Japanese institutional investors and asset managers. Due to a
culture of intra-Japanese collegiality, including extensive position
and strategy information-sharing, Japanese asset managers frequently
act in the same direction on the yen in the currency market. In
concrete terms, this frequently manifests itself in clusters of orders
at similar price or technical levels, which then reinforce those levels
as points of support or resistance. Once these levels are breached,
similar clusters of stop loss orders are frequently just behind, which
in turn fuel the breakout. Also, as the Japanese investment community
moves en masse into a particular trade, they tend to drive the market
away from themselves for periods of time, all the while adjusting their
orders to the new price levels, for instance raising limit buy orders
as the price rises.
An alternate tactic frequently
employed by Japanese asset managers is to stagger orders to take
advantage of any short-term reversals in the direction of the larger
trend. For example, if USD/JPY is at 115.00 and trending higher,
USD/JPY buying orders would be placed at arbitrary price points, such
as 114.75, 114.50, 114.25 and 114.00, to take advantage of any pullback
in the broader trend. This also helps explain why USD/JPY frequently
encounters support or resistance at numerically round levels, even
though there may be no other corresponding technical significance.
Take A Look at Trendlines
Turning to the technical side of USD/JPY, the foregoing discussion
suggests trendline analysis as perhaps the most significant technical
tool for trading USD/JPY. Because of the clustering of Japanese
institutional orders around technical or price levels, USD/JPY tends to
experience fewer false breaks of trendlines. For example, large-scale
selling interest at technical resistance will need to be absorbed if
the technical level is to be broken. This is likely to happen only if a
larger market move is unfolding, and this suggests any break will be
sustained. This makes USD/JPY ideal for breakout traders who employ
stop-loss entry orders on breaks of trendline support or resistance.
Short-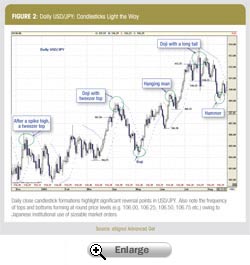 term
trendlines, such as hourly or 15 minutes, can be used effectively, but
traders need to operate on a similarly short-term basis; daily closing
levels hold the most meaning in USD/JPY. In terms of chart analysis,
Japanese institutional asset managers rely heavily on candlestick
charts (which depend heavily on daily close levels) and traders would
be well-advised to learn to recognize major candlestick patterns, such
as doji, hanging man, tweezer tops/bottoms and the like. See Figure 2.
When it comes to significant trend reversals or pauses, daily close (5
p.m. EST), candlesticks are highly reliable leading indicators. term
trendlines, such as hourly or 15 minutes, can be used effectively, but
traders need to operate on a similarly short-term basis; daily closing
levels hold the most meaning in USD/JPY. In terms of chart analysis,
Japanese institutional asset managers rely heavily on candlestick
charts (which depend heavily on daily close levels) and traders would
be well-advised to learn to recognize major candlestick patterns, such
as doji, hanging man, tweezer tops/bottoms and the like. See Figure 2.
When it comes to significant trend reversals or pauses, daily close (5
p.m. EST), candlesticks are highly reliable leading indicators.
The yen discussion above also
highlighted the factors behind the propensity of USD/JPY to trend over
the medium-term (multiweek). This facet suggests traders should look to
trend following tools such as moving averages (21- and 55-day perio ds
are heavily used), DMI, and Parabolic SAR. (This refers to J. Welles
Wilder Jr.'s Parabolic System. SAR stands for stop and reverse.)
Momentum oscillators such as the relative strength index (RSI), MACD or
stochastics should generally be avoided, especially intraday, due to
the trending and institutional nature driving USD/JPY. While a momentum
indicator may reverse course, typically suggesting a potential trade,
price action often fails to reverse enough to make the trade worthwhile
due to underlying institutional interest. Instead of reversing along
with momentum, USD/JPY price action will frequently settle into a
sideways range, allowing momentum studies to continue to unwind, until
the underlying trend resumes. Finally, Ichimoku analysis (roughly
translated as one-glance cloud chart) is another largely
Japanese-specific trend identification system that highlights trends
and major reversals.
A Look At Some Illiquid Currencies
Having looked at the two most heavily traded currency pairs, let's now
examine two of the least liquid major currency pairs, USD/CHF and
GBP/USD, which pose special challenges to technically oriented traders.
The so-called Swissy holds a place among the major currency pairs due
to Switzerland's unique status as a global investment haven; estimates
are that nearly one-third of the world's private assets are held in
Switzerland. The Swiss franc has also acted historically as a so-called
"safe-haven" currency alternative to the U.S. dollar in times of
geo-political uncertainty, but this dimension has largely faded since
the end of the Cold War. Today, USD/CHF trades mostly based on overall
U.S. dollar sentiment, as opposed to Swiss-based economic fundamentals.
The Swiss National Bank (SNB) is primarily concerned with the franc's
value relative to the euro, since the vast majority of Swiss trade is
with the European Union, and Swiss fundamental developments are
primarily reflected in the EUR/CHF cross rate.
Liquidity in USD/CHF is never
very good, and this makes it a favorite "whipping horse" for hedge
funds and other speculative interests looking to maximize the bang for
their buck. The lower liquidity and higher volatility of Swissy also
makes it a significant leading indicator for major U.S. dollar
movements. Figure 3 illustrates an example of a recent break of major
daily trendline support in USD/CHF that took place a full day before
EUR/USD and USD/JPY broke equivalent levels. Swissy will also lead the
way in 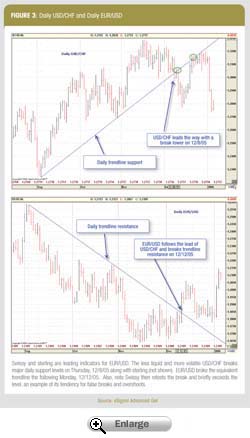 shorter-term
movements, but the overall volatility and general jitteriness of
USD/CHF price action makes false breaks of technical levels common.
These false breaks are frequently stop-loss driven and it is not
unusual for prices to trade 15-25 points through a support/resistance
level before reversing after the stop losses have been triggered. In
strong directional moves, USD/CHF price action tends toward extreme
one-way traffic, with minimal backing and filling in comparison to
EUR/USD. shorter-term
movements, but the overall volatility and general jitteriness of
USD/CHF price action makes false breaks of technical levels common.
These false breaks are frequently stop-loss driven and it is not
unusual for prices to trade 15-25 points through a support/resistance
level before reversing after the stop losses have been triggered. In
strong directional moves, USD/CHF price action tends toward extreme
one-way traffic, with minimal backing and filling in comparison to
EUR/USD.
Cable (GBP/USD), or sterling,
also suffers from relatively poor liquidity and this is in part due to
its higher pip value (U.S. dollars) and the relatively Euro-centric
basis of U.K. trade. Sterling shares many of the same trading
characteristics of Swissy outlined just above, but Cable will also
react sharply to U.K. fundamental data as well as to U.S. news.
Sterling's price action will also display extreme one-way tendencies
during larger moves, as traders caught on the wrong side chase the
illiquid market to the extremes.
Focus On Risk Management
The volatility and illiquidity of Swissy and sterling suggests traders
need to use a more proactive overall approach to trading these pairs,
particularly concerning risk management (i.e. position size in relation
to stop levels). With regard to technical tools, the tendency for both
pairs to make short-term false breaks of chart levels suggests breakout
traders need to be particularly disciplined concerning stop entry
levels and should consider a greater margin of error on the order of
30-35 points. In this sense, trendline analysis of periods less than an
hour tends to generate more noise than tradable break points, so a
focus on longer time periods (four hours-daily) is likely to be more
successful in identifying meaningful breaks. By the same token, once a
breakout occurs, surpassing the margin of error, the ensuing one-way
price action favors traders who are quick on the trigger, and this
suggests employing resting stop-loss entry orders to reduce slippage.
For those positioned with a move, trailing stops with an acceleration
factor, such as parabolic SAR, are well suited to riding out
directional volatility until a price reversal signals an exit.
The volatility inherent in Cable
and Swissy makes the use of short-term (hourly and shorter) momentum
oscillators problematic, due to both false crossovers and divergences
between price/momentum that frequently occur in these time frames.
Longer-period oscillators (four hours and more) are best used to
highlight potential reversals or divergent price action, but volatility
discourages initiating trades based on these alone. Instead, momentum
signals need to be confirmed by other indicators, such as breaks of
trendlines, Fibonacci retracements or parabolic levels, before a trade
is initiated.
Try A Larger Retracement
With regard to Fibonacci retracement levels, the greater volatility of
Cable and Swissy frequently sees them exceed 61.8-percent retracements,
only to stall later at the 76.4-percent level, by which time most
short-term Elliott wave followers have been stopped out. Short-term
spike reversals of greater than 30 points also serve as a reliable way
to identify when a directional surge, especially intraday, is
completed, and these can be used as both profit taking and
counter-trend trading signals. For counter-trend, corrective trades
based on spike reversals, stops should be placed slightly beyond the
extreme of the spike low/high. A final technical study that is well
suited to the explosiveness of Swissy and sterling is the Williams %R,
an overbought/oversold momentum indicator, which frequently acts as a
leading indicator of price reversals. The overbought/oversold bands
should be adjusted to -10/-90 to fit the higher volatility of Cable and
Swissy. As with all overbought/oversold studies, however, price action
needs to reverse course first before trades are initiated.
It's Not One Size Fits All
Traders who seek to apply technical trading approaches to the currency
market should be aware of the differences in the trading
characteristics of the major currency pairs. Just because the euro and
the pound are both traded against the dollar does not mean they will
trade identically to each other. A more thorough understanding of the
various market traits of currencies suggests that certain technical
tools are better suited to some currency pairs than others. A
currency-specific approach to applying technical analysis is more
likely to produce successful results than a one-size-fits-all
application across all currency pairs.

|
|


)
)
)